Analysis of CTA Indices
Copyright © 2003-2016 Red Rock Capital, LLC. All rights reserved.
The risk of loss in trading commodities & futures contracts can be substantial. You should therefore carefully consider whether such trading is suitable for you in light of your financial condition. The high degree of leverage that is often obtainable in commodity trading can work against you as well as for you. The use of leverage can lead to large losses as well as gains. In some cases, managed commodity accounts are subject to substantial charges for management and advisory fees. It may be necessary for those accounts that are subject to these charges to make substantial trading profits to avoid depletion or exhaustion of their assets. The disclosure document contains a complete description of the principal risk factors and each fee to be charged to your account by the Commodity Trading Advisor. The regulations of the Commodity Futures Trading Commission require that prospective clients of a CTA receive a disclosure document at or prior to the time an advisory agreement is delivered and that certain risk factors be highlighted. This document is readily accessible from Red Rock Capital, LLC. This brief statement cannot disclose all of the risks and other significant aspects of the commodity markets. Therefore, you should thoroughly review the disclosure document and study it carefully to determine whether such trading is appropriate for you in light of your financial condition. The CFTC has not passed upon the merits of participating in this trading program nor on the adequacy or accuracy of the disclosure document. Other disclosure statements are required to be provided you before a commodity account may be opened for you.
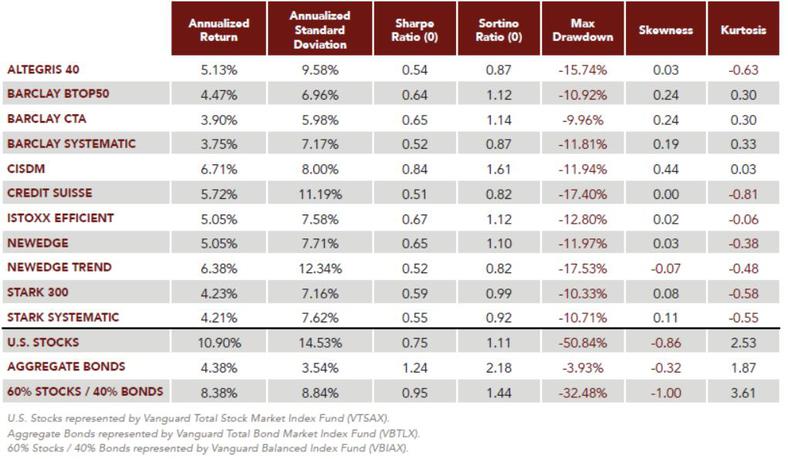
Performance Statistics
Indices with a larger number of constituents tend to be less volatile than indices with a smaller number of constituents possibly due to the more diversification represented by the more broadly defined indices.
During the analysis period the maximum drawdowns for all CTA indices were substantially lower than for U.S. Stocks and the traditional 60% Stocks / 40% Bonds institutional portfolio. Furthermore, all three
traditional asset class variants exhibited significant amounts of negative skewness, which means the
distribution of monthly returns was impacted more by negative outliers than positive outliers – i.e. they
showed a propensity for downside volatility / negative fat tails.
When comparing the performance of CTA indices to those of traditional asset classes like stocks and bonds, it is important to recognize that the return reported by CTAs does not include the return on interest
earned on any notional amount invested in the program. This is a significant point which will understate, and in periods of higher interest rates significantly understate, the actual return earned by an investor in
a CTA program.
This is because of the notional funding possible in a futures account whereby an investor in a CTA program is only required to deposit a small fraction of the nominal account size used by the CTA to determine the size of trading positions. The amount not on deposit as margin with the futures broker, termed the notional amount, is retained by the investor and can earn interest outside the futures account. This interest is in fact earned by the investor, but is not includable in the CTA’s reported performance. Current regulations prohibit CTAs from imputing interest earned on notional funds; they may only report returns actually earned in the futures account.
All indices in our survey were very highly correlated to each other regardless of index size, composition,
weighting method, or calculation methodology. For the period of 2003 through 2014, the average corre-lation was 0.94 with a minimum of 0.89.
January 2003 - December 2014